What is the GPCI?
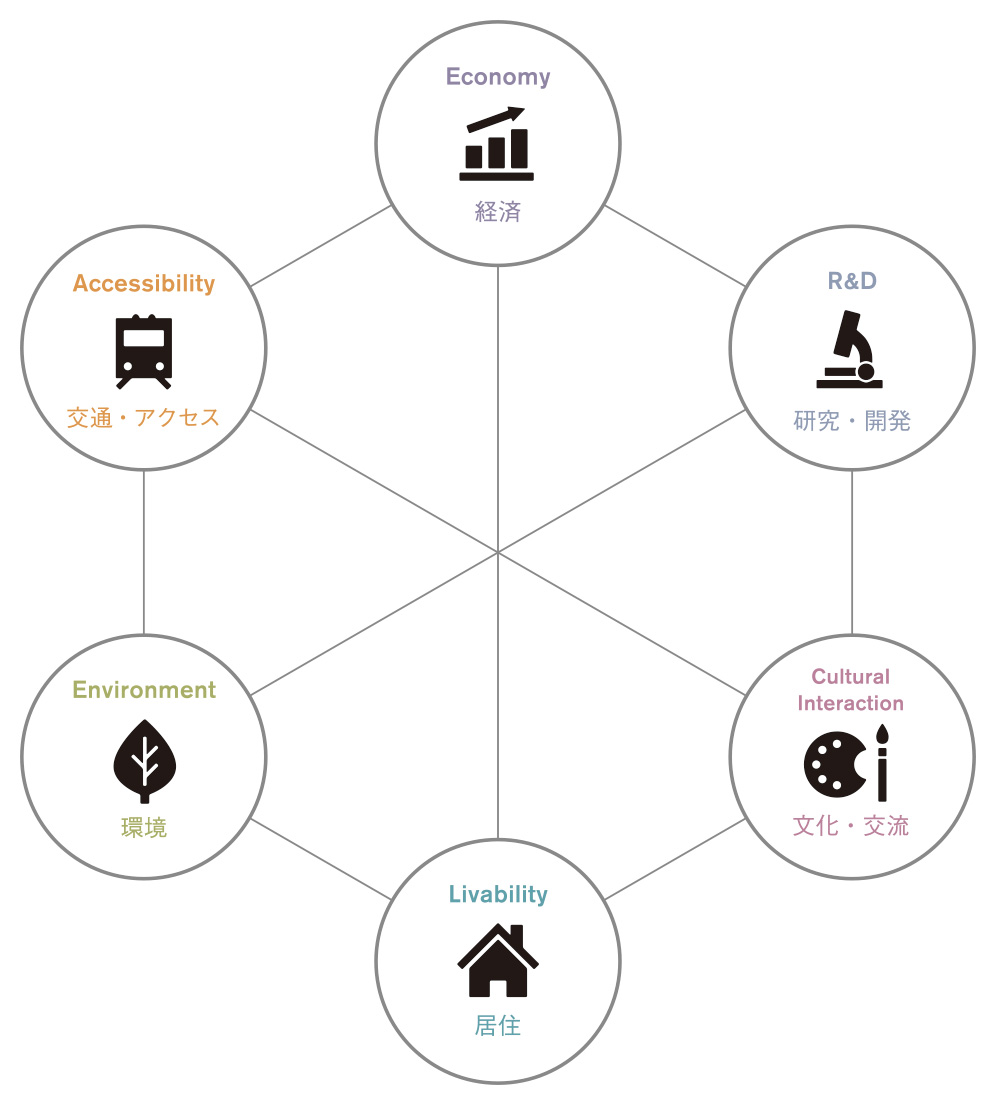
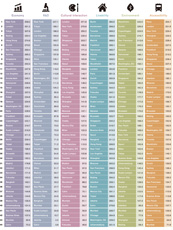
Given the global competition between cities, the Global Power City Index (GPCI) evaluates and ranks the major cities of the world according to their “magnetism,” or their comprehensive power to attract people, capital, and enterprises from around the world. It does so through measuring 6 functions—Economy, Research and Development, Cultural Interaction, Livability, Environment, and Accessibility—providing a multidimensional ranking. The GPCI’s indicators and data collection methods are routinely reviewed and improved in order to reflect the changing circumstances surrounding global cities.
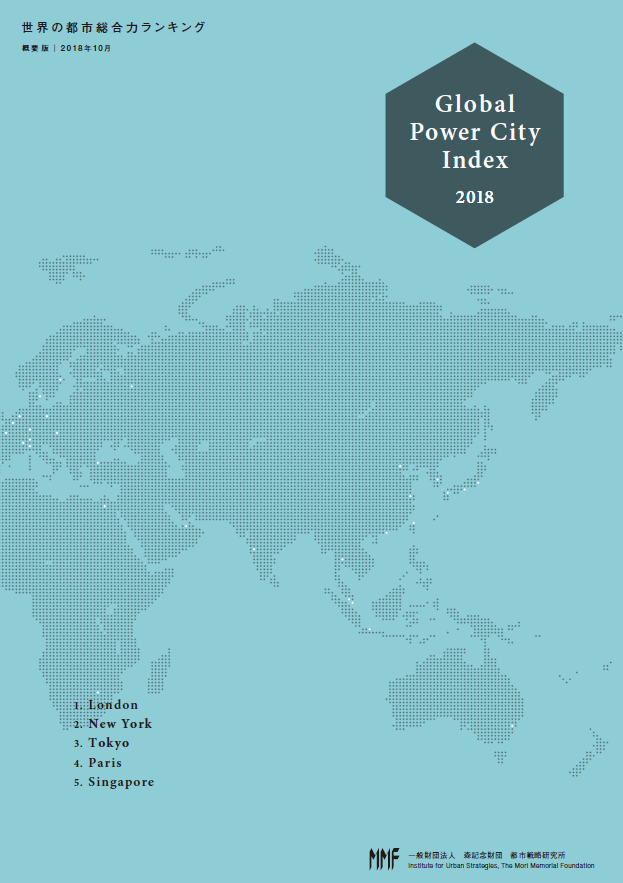
Download the latest GPCI-2018 report
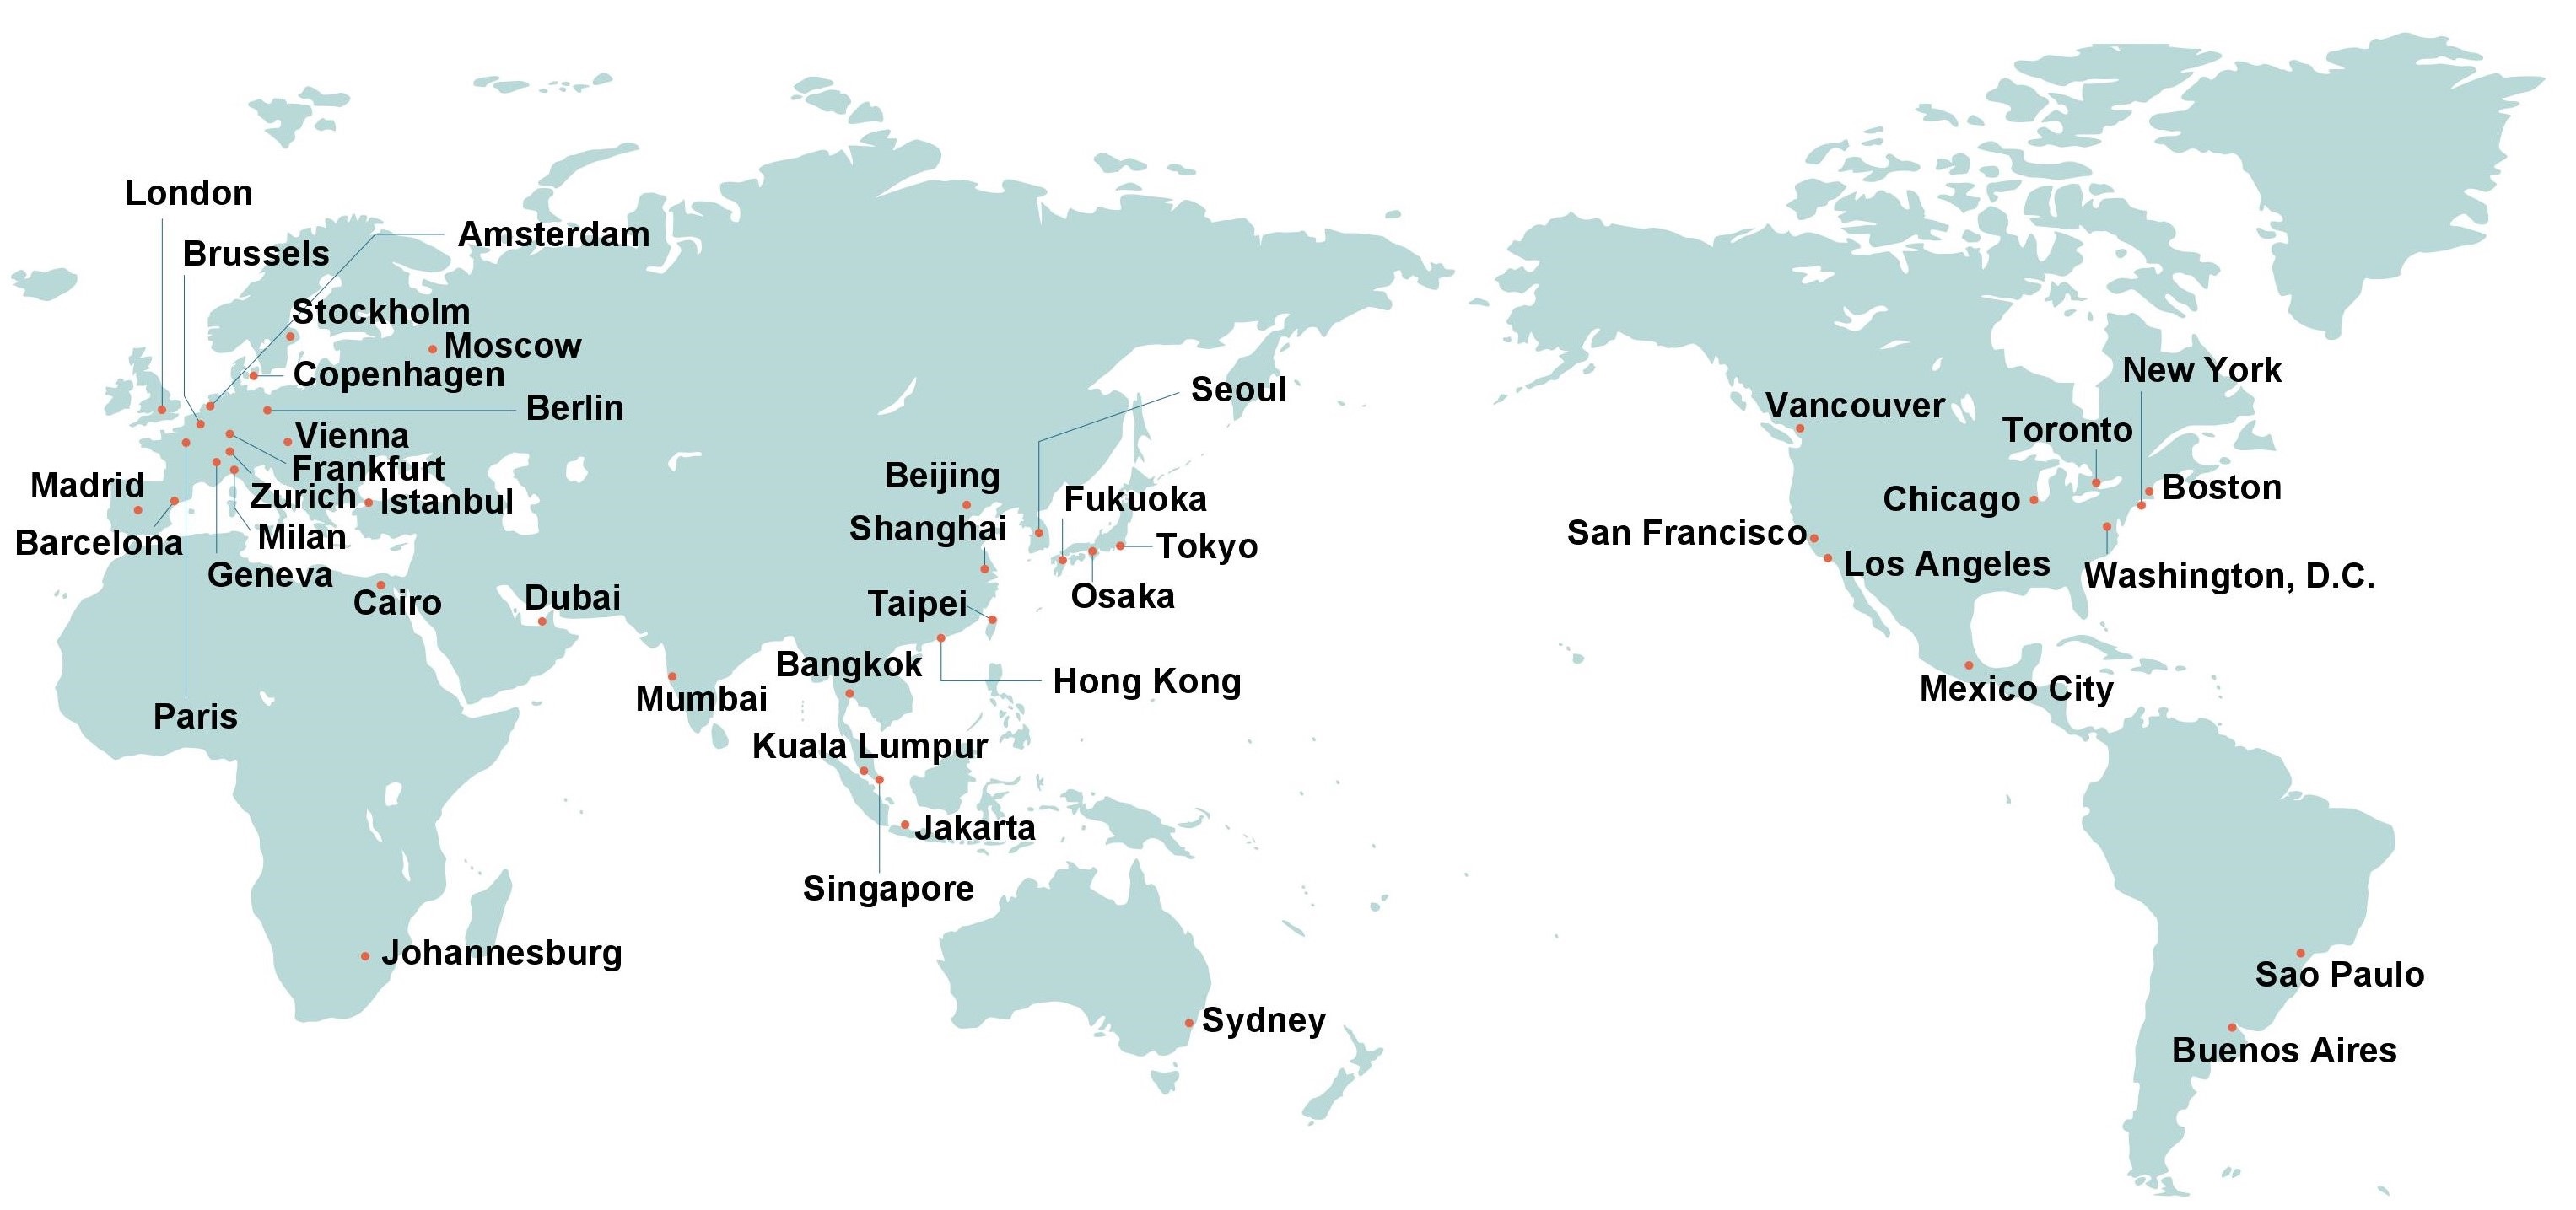
Target Cities
Executive Summary
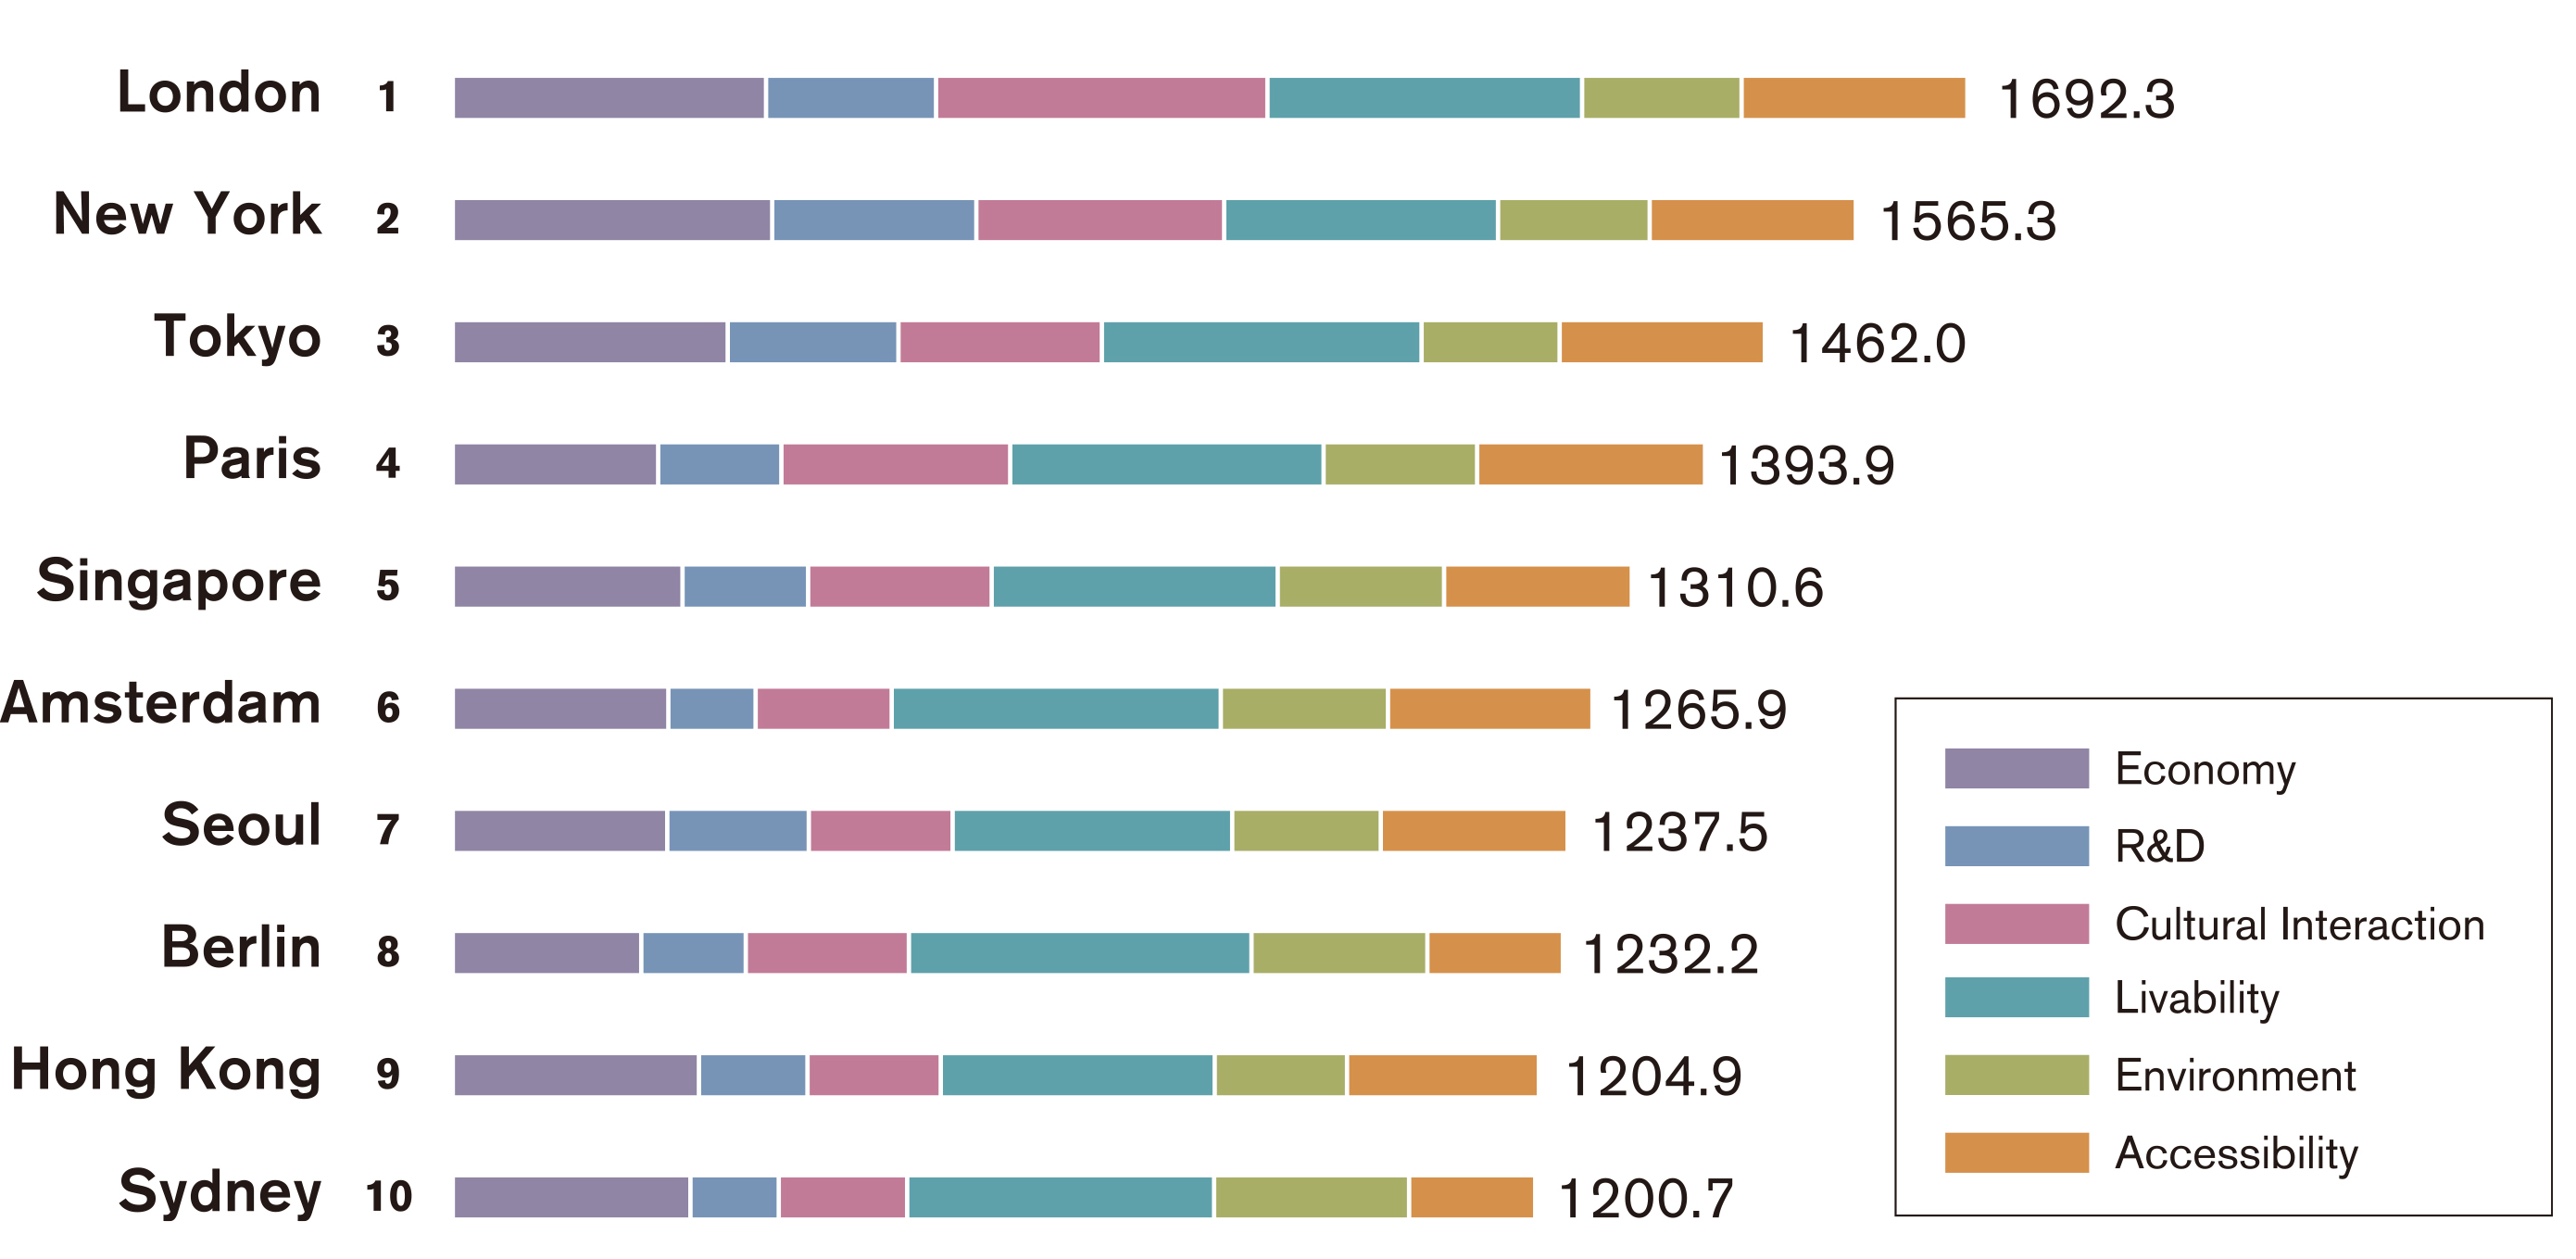
Top 10 Cities
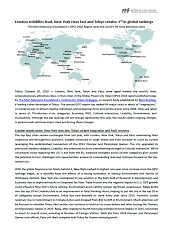
This year’s comprehensive ranking sees the top 5 remain unchanged from last year, with London, New York, Tokyo, Paris, and Singapore maintaining their positions. Despite slight changes in 2012 when London passed New York for #1, and 2016 when Tokyo surpassed Paris to claim the #3 spot, these cities have been included in the top 5 for ten consecutive years.
Amsterdam greatly extends its score and moves past Seoul, now ranking at #6 this year. Along with the city’s previously strong evaluation in Livability, GDP Growth Rate also rises, bringing up results in the Economy function.

London is for the 7th consecutive year evaluated as the most comprehensively powerful city at #1. With its score increasing even after the Brexit referendum, the city marches forward alone at the top of the ranking. London also manages to enter the top 5 in 13 out of 16 indicators in its key strength Cultural Interaction, further cementing its status as a city with extremely high comprehensive power. The city sees its scores for weaker indicators Housing Rent and Price Level rise, carrying it from #17 to #11 in Livability.

New York shows its highest increase in score since the ranking began as it benefits from the effects of a strong evaluation in Startup Environment and Variety of Workplace Options. The city maintains its top position in the Economy function this year due to improved results in Corporate Tax Rate as well. Although New York is also evaluated highly in other functions—#1 in R&D, #2 in Cultural Interaction, and #3 in Accessibility—the city’s #25 Environment, and #28 Livability remain significant weaknesses.

Despite not experiencing a rise in score as high as the top 2 cities, Tokyo still manages to maintain its seat at #3. In Livability, the city enters the top 10 as it sees improvement in the indicator Total Working Hours. Although Tokyo reaches #3 in the Economy function due to better scores in indicators such as GDP Growth Rate, it receives relatively low scores for Commitment to Climate Action, dropping from #12 to #29 in Environment. Should Tokyo enhance its results in Environment, which is the only function where it ranks outside of the top 10, the city would likely become more balanced in comprehensive power.
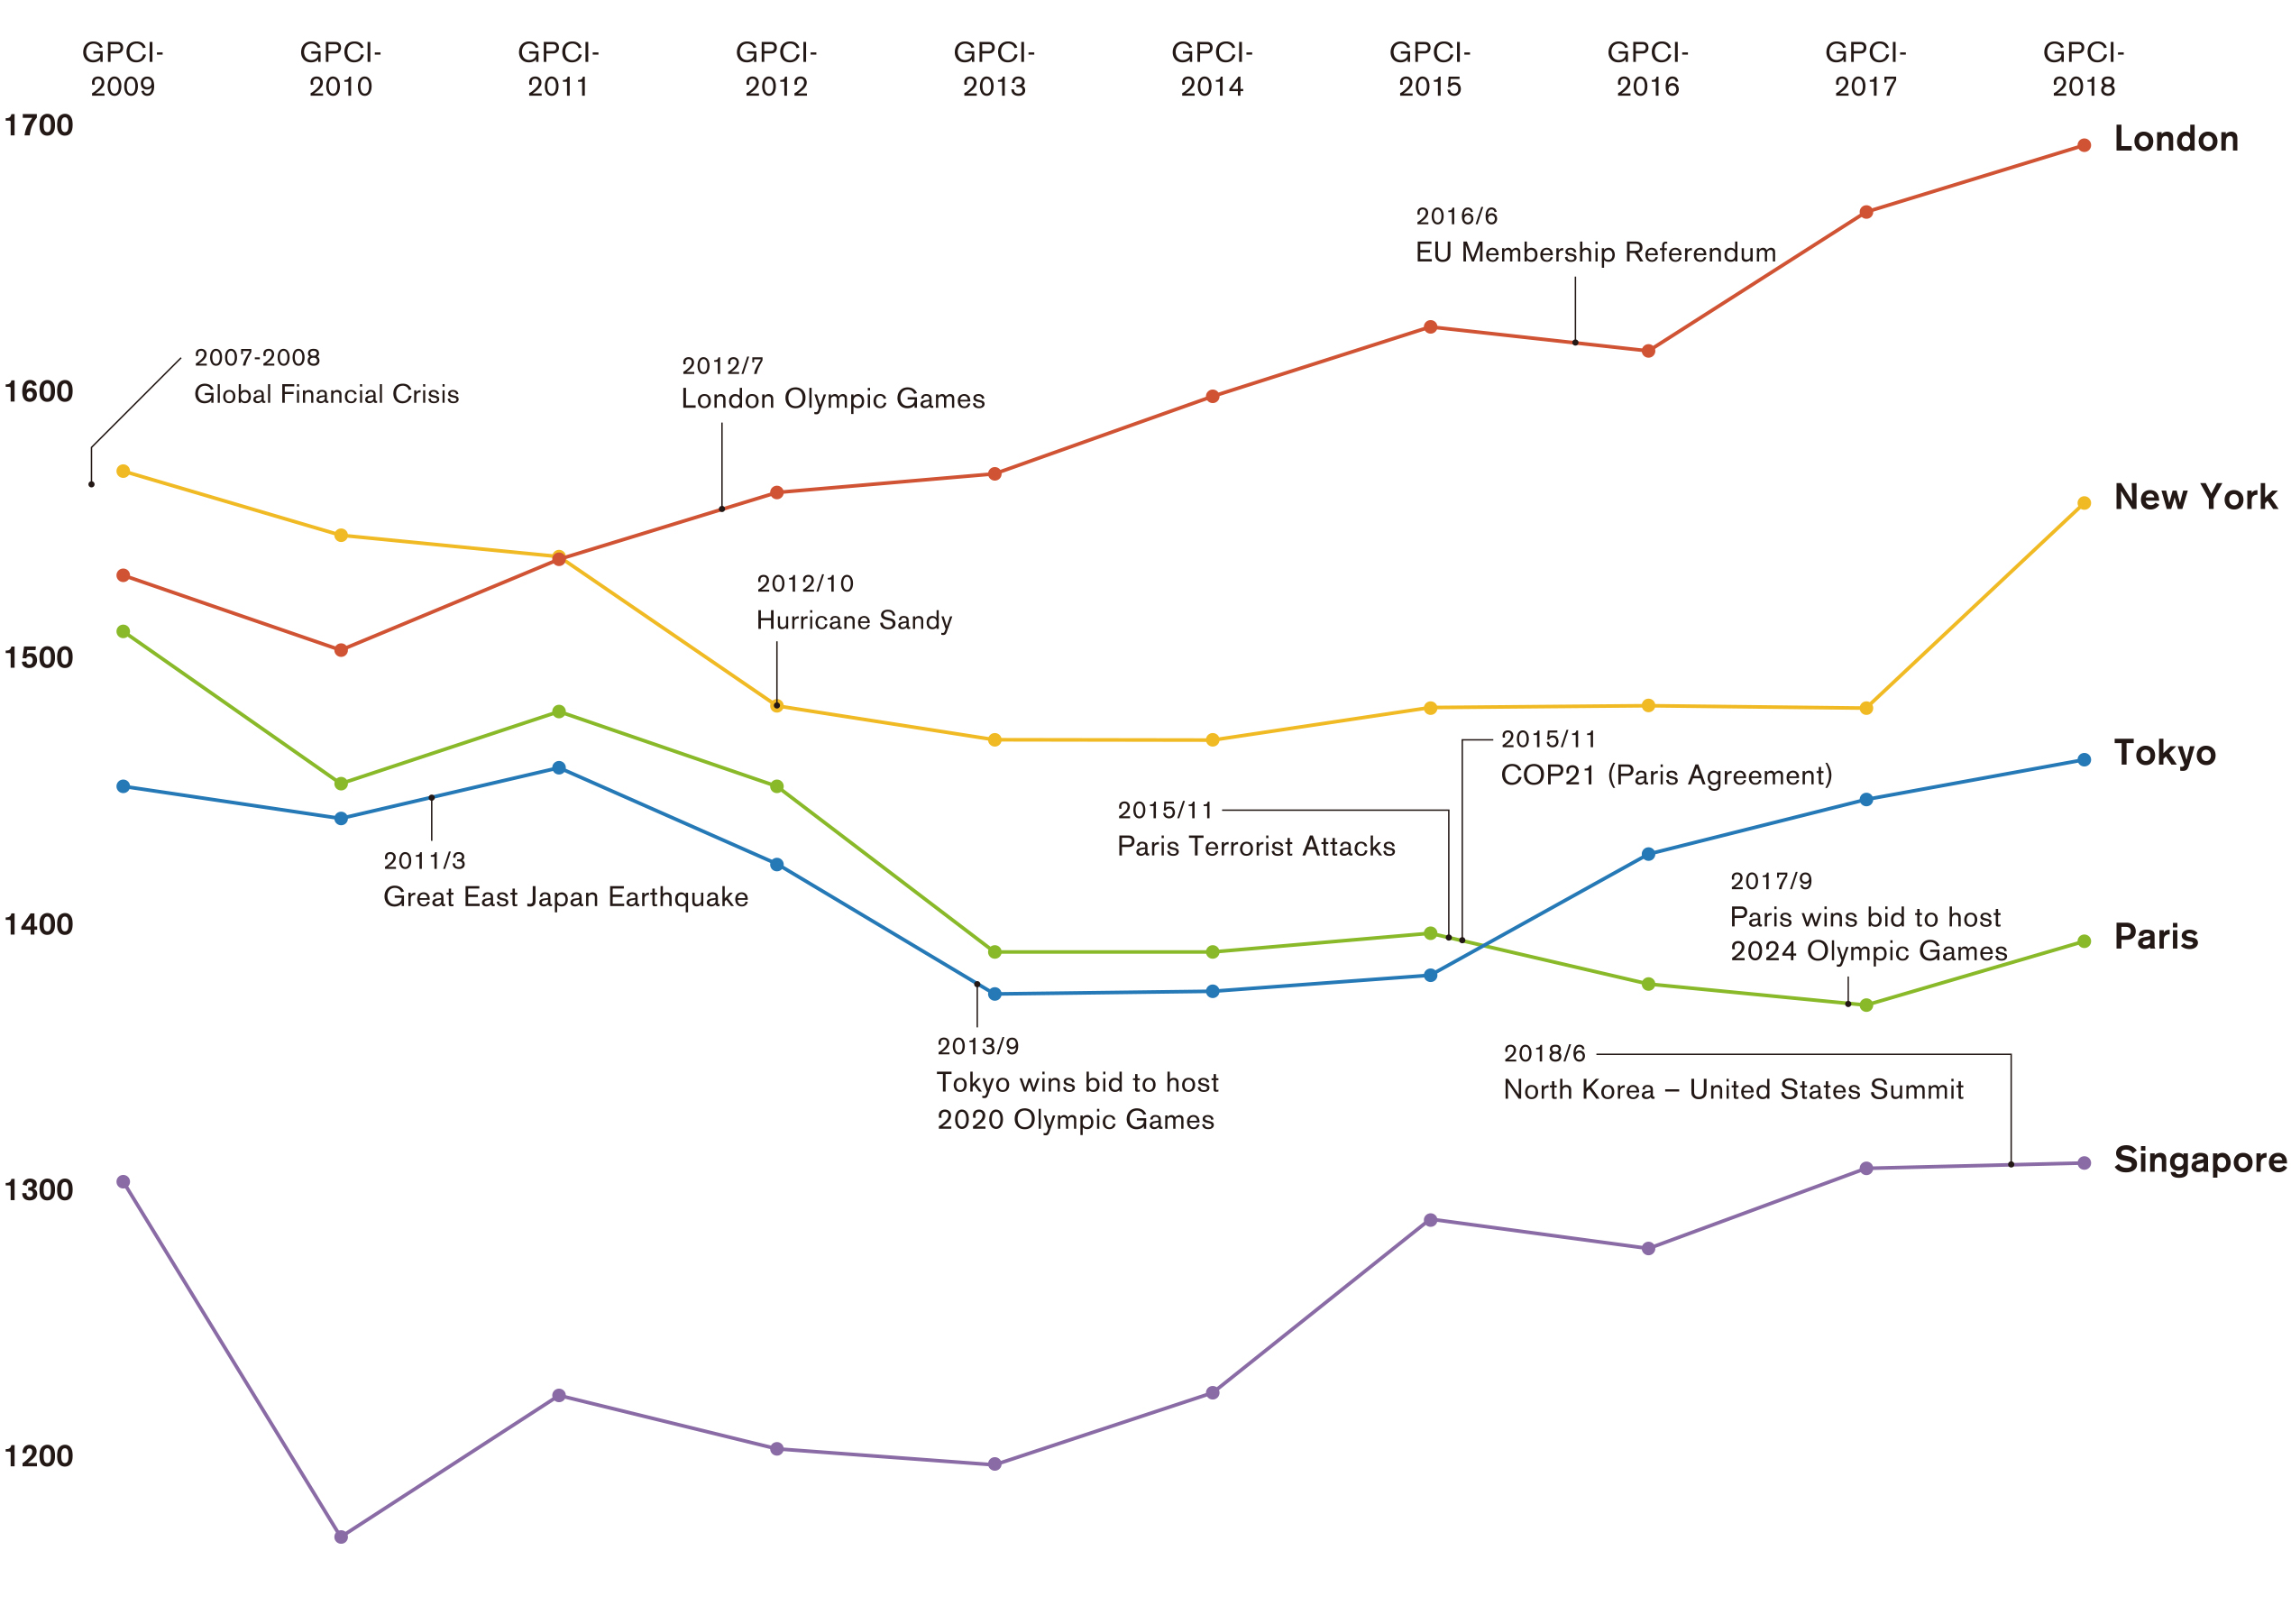
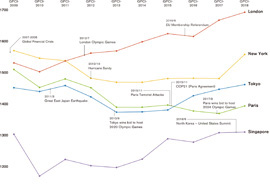
Score Fluctuation of Top 5 Cities
London’s score rises as it competes alone at the top and the momentum leading to, and following, the 2012 Olympic Games continues unabated. New York displays its largest increase in score since the ranking was first published. Ranked third, Tokyo also sees continued improvement in score from 2015 onward, though attention will be focused on whether, like London, Tokyo can continue to extend its score for a long period following the 2020 Olympic Games.
Reports
GPCI-2018 SUMMARY
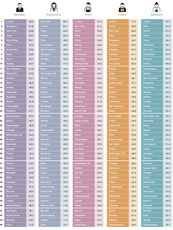
“Global Power City Index 2018 Summary” uses figures and charts to clearly introduce a city’s power through the lens of 6 functions (Economy, R&D, Cultural Interaction, Livability, Environment, Accessibility) covered in the Function-Specific Ranking, as well as through the viewpoint of 5 urban actors (Manager, Researcher, Artist, Visitor, Resident) in the Actor-Specific Ranking.
GPCI-2018 YEARBOOK
Release Date: 21 December, 2018
Bilingual (Japanese and English)
Print Edition: JPY 20,350 (tax included)
PDF: JPY 16,500 (tax included)
The Global Power City Index YEARBOOK 2018 is a full report of the GPCI-2018, providing a detailed account of its methodology and results. The city profiles analyze each of the 44 target cities of the GPCI and illustrate the city’s strengths and weaknesses in reference to the score and ranking of the 70 indicators. The detailed definitions and sources of the indicators are also included in the book.
Press Resources
- GPCI 2025
- GPCI 2024
- GPCI 2023
- GPCI 2022
- GPCI 2021
- GPCI 2020
- GPCI 2019
- GPCI 2018
- GPCI 2017
- GPCI 2016
- GPCI 2015
Contact
If you have any questions about the Global Power City Index, please contact iusall@mori-m-foundation.or.jp
PUBLICATIONS
For more information about the Global Power City Index, please see the Summary or order the YEARBOOK. You can download the PDF version of the Summary below. The YEARBOOK provides specific details on the methods of research, definition of indicators, lists of data sources, and scores and ranking analysis of each city.