Global Power
Inner City Index 2015
Fierce competition between cities is unfolding on a global scale. Each of these metropolises has an “inner-city” area, which embodies the city’s competitiveness in. A number of city rankings already exist that measure the competitiveness of global cities. However, we have yet to see a city ranking that limits its scope of study and research to the inner-city areas of the world’s cities.
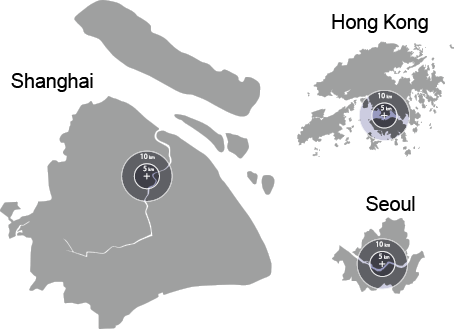
Thus, the Global Power Inner City Index (GPICI) studies and analyzes the “comprehensive inner-city power” of eight of the world’s leading cities, with the purpose of uncovering their respective strengths, weaknesses, appeal, and challenges.
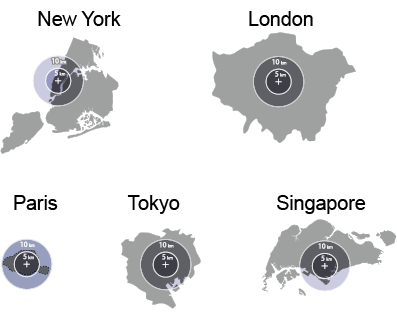
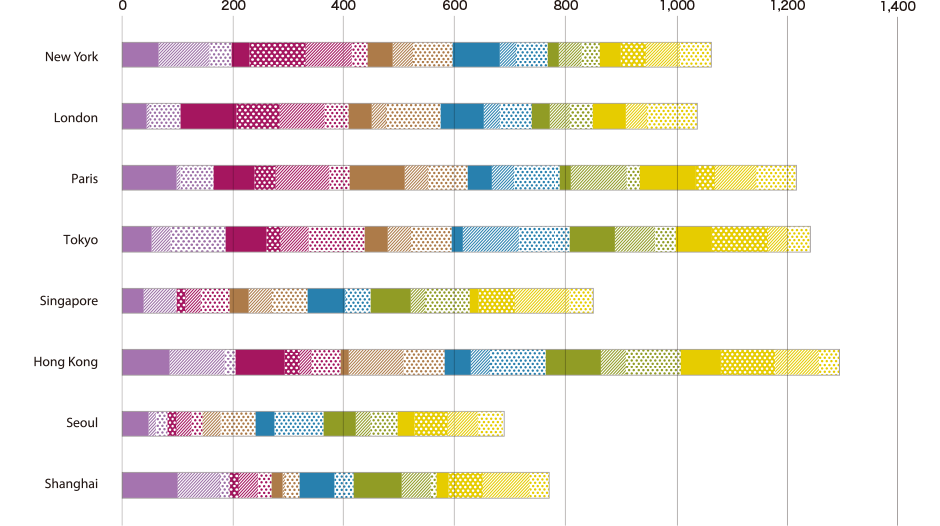
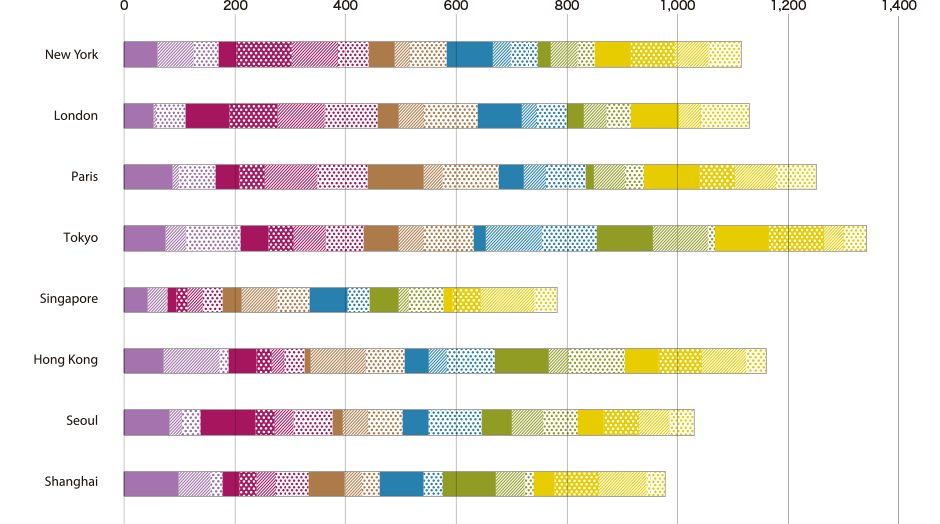
In assessing comprehensive inner-city power, we first categorized the key elements of inner-city areas into six functions, namely, Vitality, Culture, Interactivity, Luxury, Amenities, and Mobility. Next, we established 20 indicators with a particular focus on the concentration of urban functions in order to accurately assess the six functions.


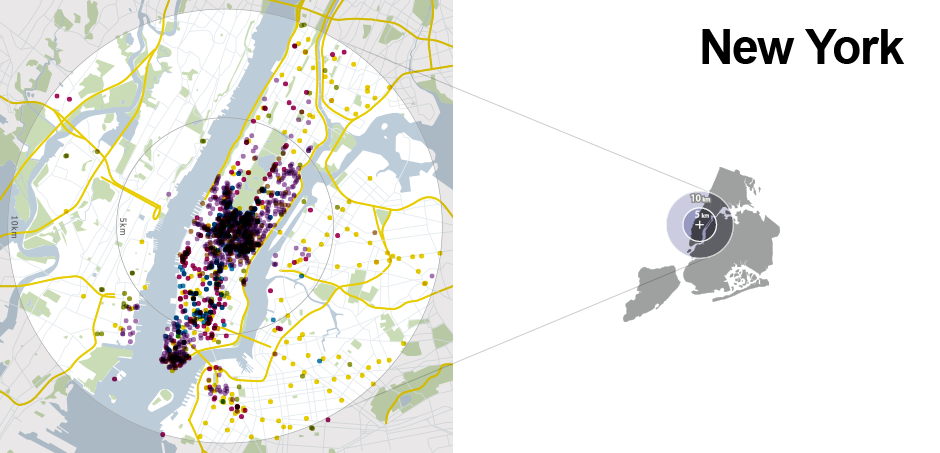
GPICI also sheds light on the spread of urban functions by plotting data for each indicator on city maps, thus allowing quick identification of the relative performances of the cities for each indicator.
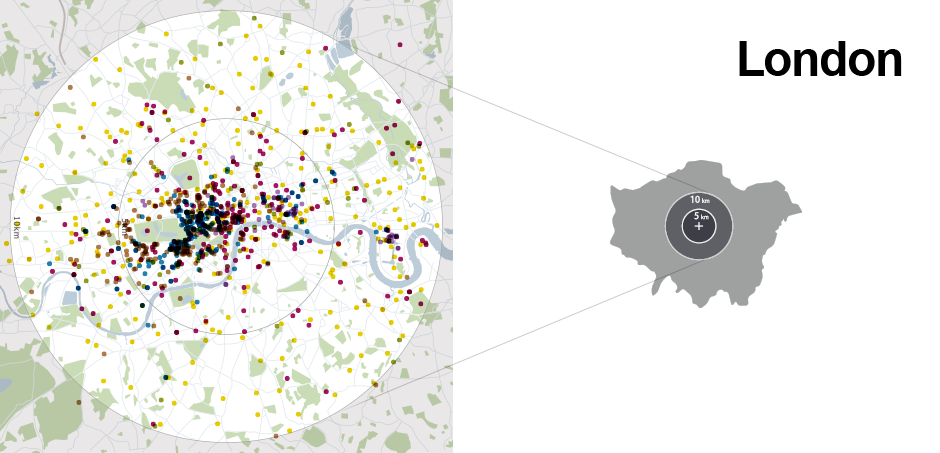
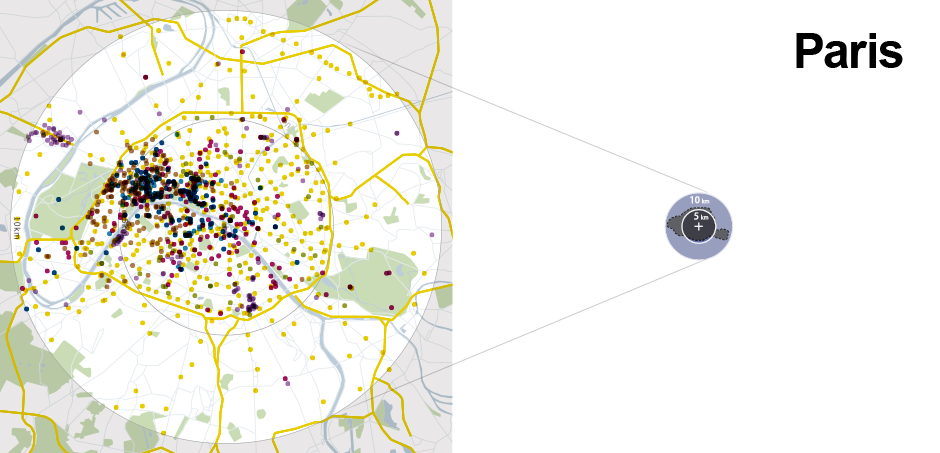
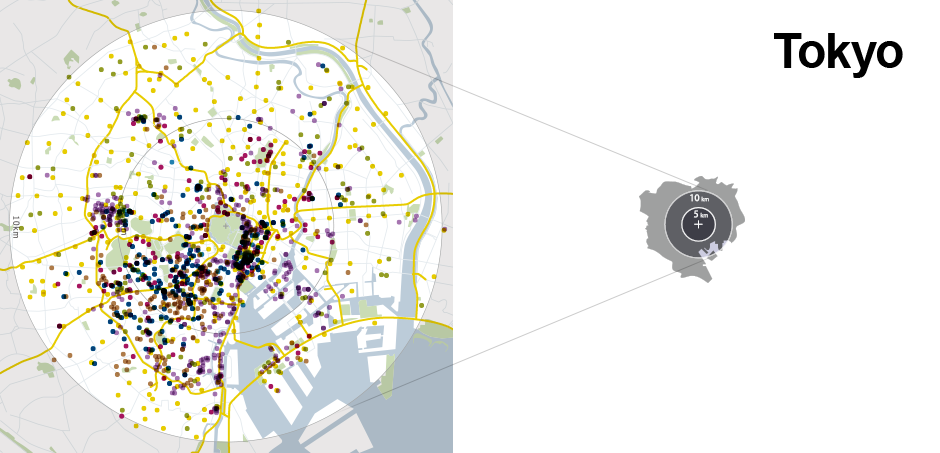
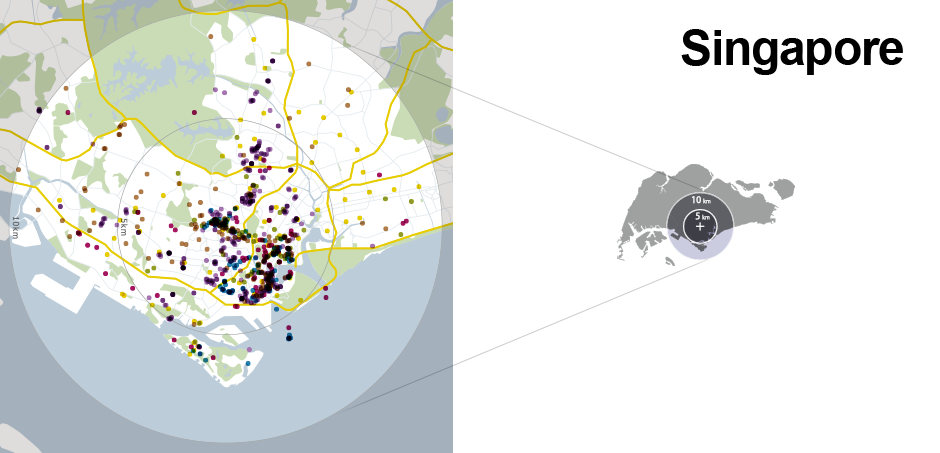
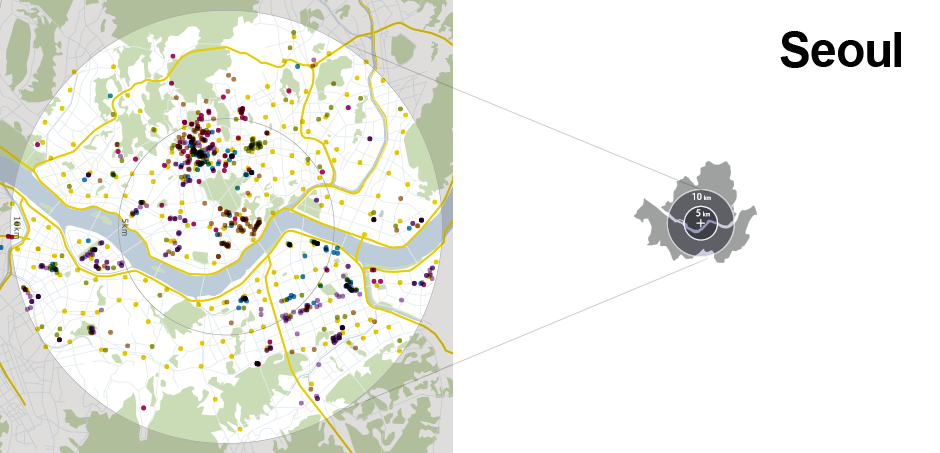
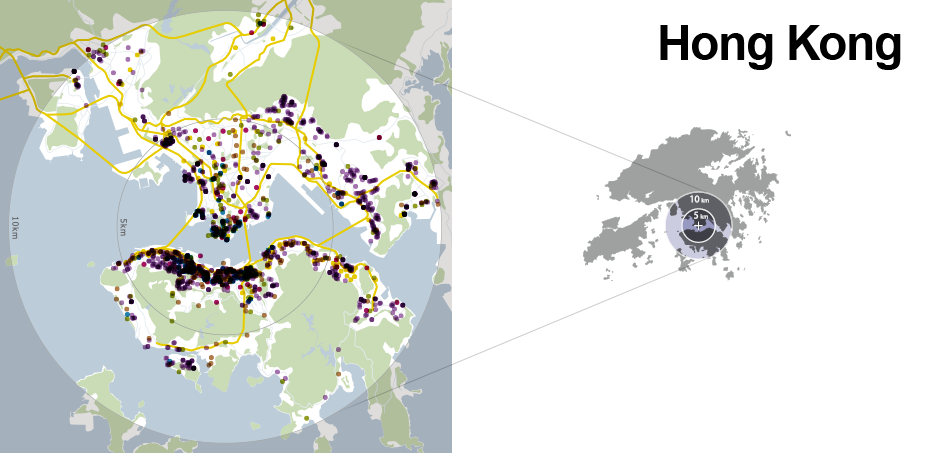
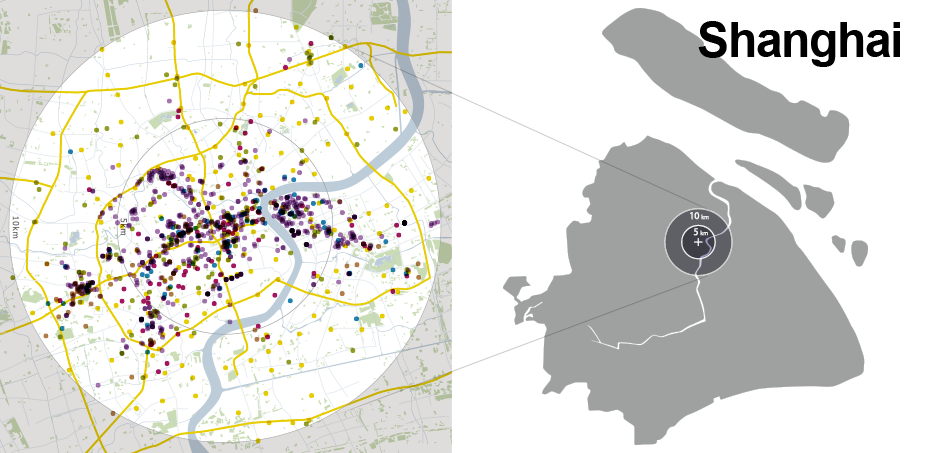
As part of our analysis, the scores for all 20 indicators were tallied for both the 5 km and 10 km target areas and listed in order to create a ranking on the comprehensive power of inner-city areas.


Based on the scores for all 20 indicators, deviation scores were also calculated for each indicator in both the 5 km and 10 km target areas to analyze the strengths and weaknesses of the inner-city areas of each city. To know more about GPICI, please visit Publications.
PUBLICATIONS
To purchase the report of the Global Power Inner City Index, please click on “Go to Publication”. A preview version is available below.