Global Power City Index 2015
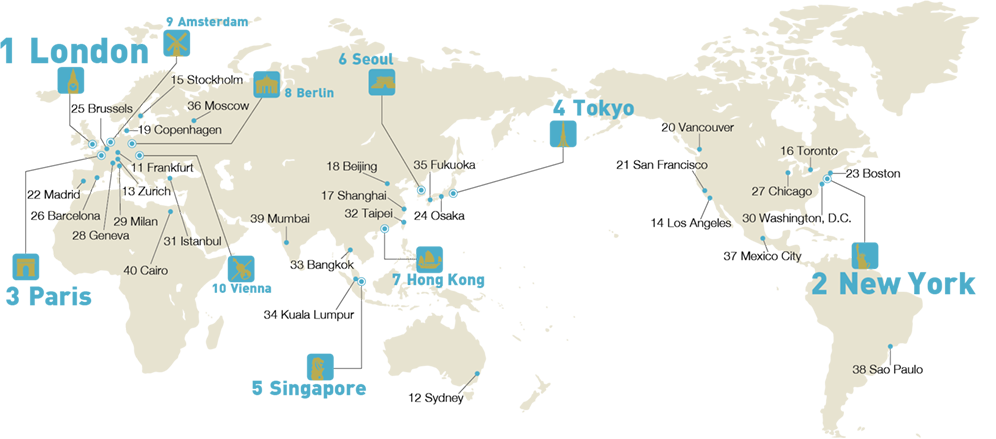
The Global Power City Index (GPCI) evaluates and ranks the major cities of the world according to their “magnetism,” i.e. their comprehensive power which allows them to attract creative individuals and business enterprises from every continent and to mobilize their assets in securing economic, social, and environmental development.GPCI evaluates the comprehensive power of forty of the world’s leading cities according to six main functions (Economy, Research and Development, Cultural Interaction, Livability, Environment and Accessibility) representing city strength.
For more results of the 40 cities, please visit our desktop website.
 London
Paris
Tokyo
Singapore
Seoul
Amsterdam
Berlin
Hongkong
Vienna
Frankfurt
Zurich
Sydney
Beijing
Shanghai
Stockholm
Toronto
Copenhagen
Madrid
Los Angeles
Istanbul
Vancouver
Brussels
Washington, D.C.
Milan
Osaka
Barcelona
Geneva
Bangkok
Boston
Chicago
San Francisco
Taipei
Kuala Lumpur
Moscow
Fukuoka
Mexico City
Sao Paulo
Mumbai
Cairo
London
Paris
Tokyo
Singapore
Seoul
Amsterdam
Berlin
Hongkong
Vienna
Frankfurt
Zurich
Sydney
Beijing
Shanghai
Stockholm
Toronto
Copenhagen
Madrid
Los Angeles
Istanbul
Vancouver
Brussels
Washington, D.C.
Milan
Osaka
Barcelona
Geneva
Bangkok
Boston
Chicago
San Francisco
Taipei
Kuala Lumpur
Moscow
Fukuoka
Mexico City
Sao Paulo
Mumbai
Cairo
- 2015 Rank
- 4
40
-
2014
4
-
2013
4
-
2012
4
-
2011
4
TOKYO/東京
-
- Population
- 9,067 1,000people
-
- Area
- 623 km2
-
- Nominal GDP
- 9,646 100 million U.S. $
- Strength
-
- Weakness
-
KEY FINDINGS
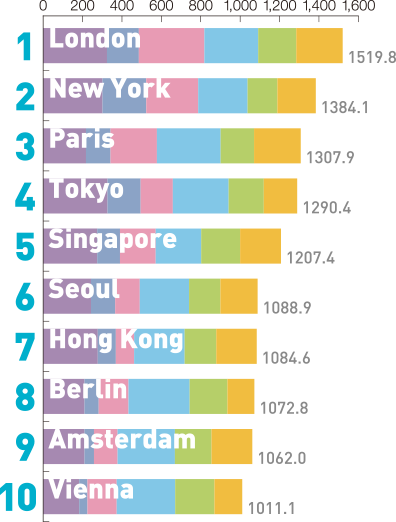
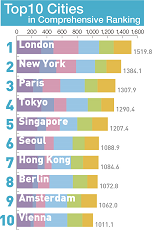
Top 10 Cities
-
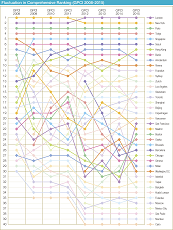
London has maintained the top position since 2012, falling within the top three for all functions other than Livability and Environment. As it geared up for the 2012 Olympic and Paralympic Games and other major cultural and sporting events, London greatly improved its overall magnetism.
Since surrendering the top spot to London in 2012, New York has remained at second place. In Research and Development, Cultural Interaction and Economy, the city ranks third or higher, but it is held back by poor scores in Livability, Environment and Accessibility.
Paris has stayed in third place since 2008. It is the weakest of the top four cities in Economy, but is ranked in the top five for Livability, Accessibility, Cultural Interaction and Research and Development.
Tokyo maintains the fourth-place ranking it has held since the first GPCI in 2008. The Japanese capital still has a comfortable lead as the top Asian city, but Tokyo lags behind the top three cities in terms of Cultural Interaction and Accessibility.
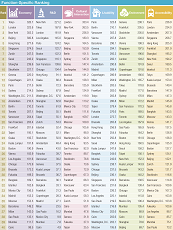
Function-Specific Rankings
-

-
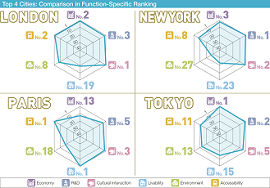
Economy
Tokyo (#1), London (#2), and New York (#3) top the list in this function based on their high scores for and The cities of North America and other English-speaking urban centers, such as London and Singapore, boast outstanding scores for Ease of Securing Human Resources.
-

-
Research and Development
New York (#1) powers ahead of Tokyo, London, and Los Angeles in this function. Los Angeles (#4) is home to some of the world’s leading educational institutions, including The California Institute of Technology, and therefore scores highly for World's Top 200 Universities , Number of Winners of Highly - Reputed Prizes (Science and Technology - related Fields) , Number of Researchers , and Research and Development Expenditure .
-

-
Cultural Interaction
Cultural Interaction has the top five cities in order as London, New York, Paris, Singapore, and Tokyo. London (#1) has pulled away from the other four cities with high scores in all indicators.
-

-
Livability
London, New York, and Tokyo, cities that rank highly for Economy and Cultural Interaction , have relatively low scores in Livability. This is reflected in the high , such as Average House Rent and Price Level. Paris continues to be ranked #1 in this function this year, given that its is not as high as the other top cities.
-
-
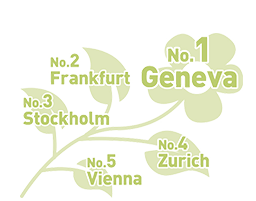
Environment
All of the top five places in this function are occupied by European cities (Geneva, Frankfurt, Stockholm, Zurich, and Vienna). The high scores for CO2 Emissions , Percentage of Waste Recycled , and Percentage of Renewable Energy Used point to the innovative environmental policies these cities employ.
-

-
Accessibility
Since the release of the first GPCI in 2008, London and Paris have continued to battle for top spot in this function, with the latter prevailing this year. London’s relinquishing title can be attributed to its overall score decline, which includes an increase in the number of Transportation Fatalities per Population .
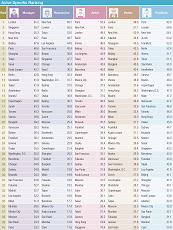
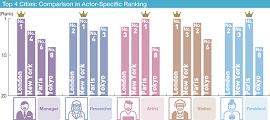
Actor Specific Rankings
Additionally, the same cities were examined from the viewpoints of four global actors (Manager, Researcher, Artist and Visitor) and one local actor (Resident). They are personifications of representative citizens with diverse sets of needs and preferences.
Go to Publications for more about the GPCI.
PRESS RESOURCES
Global Power City Index 2015 Press Release
-
-
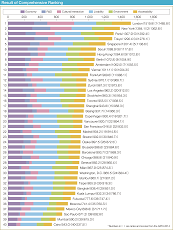
Ranking of the 40 Cities
JPEG Download
-
-
Top 10 Cities by Function
JPEG Download
-
-
Result of Comprehensive Ranking
JPEG Download
-
-
Function-Specific Ranking
JPEG Download
-
-
Actor-Specific Ranking
JPEG Download
-
-
Fluctuation in Comprehensive Ranking
JPEG Download
-
-
Top 4 Cities: Comparison in Function-Specific Ranking
JPEG Download
-
-
Top 4 Cities: Comparison in Actor-Specific Ranking
JPEG Download
-
-
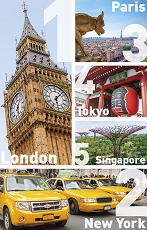
Top 5 Cities Image
JPEG Download
- GPCI 2025
- GPCI 2024
- GPCI 2023
- GPCI 2022
- GPCI 2021
- GPCI 2020
- GPCI 2019
- GPCI 2018
- GPCI 2017
- GPCI 2016
- GPCI 2015
PUBLICATIONS
For more information about the Global Power City Index, please see the Summary or order the YEARBOOK. You can download the PDF version of the Summary below. The YEARBOOK provides specific details on the methods of research, definition of indicators, lists of data sources, and scores and ranking analysis of each city.

COMMENTS FROM URBAN EXPERTS
Tokyo is a city where tradition and innovation converge, constantly generating new styles and trends. It is also a city rich with beautiful waterside spaces and a diverse food culture. My aim is to make Tokyo an even more livable, enjoyable, and comfortable mature city. To achieve this goal we are now surging ahead with initiatives to create a “hydrogen society,” to make Tokyo the world’s first metropolis with no traffic congestion, and to build a society where everyone—men and women alike—can play an active role. Just as London became the world’s top ranking city after successfully hosting the Olympic and Paralympic Games in 2012, Tokyo will also take the opportunity provided by the 2020 Games to accelerate efforts and rise to the rank of the “best city in the world.”
Yoichi Masuzoe
Former Governor of Tokyo
With a thriving economy, an unrivalled cultural scene, numerous top sporting venues, some of the best universities in the world, a low crime rate and much else besides, it is no wonder that London continues to outstrip other cities across the world. As London grows to record levels we are working hard to build the new homes and deliver the infrastructure that will ensure we remain a global powerhouse for decades to come.
Boris Johnson MP
Former Mayor of London
London continues to retain its position in the global hierarchy of cities. London property is seen as a secure and safe haven for footloose international investment, both from institutions such as Sovereign Wealth Funds and Pension Funds, and from individual investors. The London housing market, in particular, is attracting a lot of Russian, Asian and Middle Eastern investors. London is experiencing a continued increase in tourist numbers on the back of the 2012 Olympics and other events such as the Rugby World Cup. New transport investments, Crossrail, are taking place as are other projects to make London a better place for walking and cycling. The biggest issues facing London in the coming years (and that will be on the next Mayor's agenda in 2016) are the need for further investment in public transport, airport capacity, housing affordability and the devolution of greater decision making powers from central government.
Peter Bishop
Professor, University College London
London is enjoying the fruits of a long cycle of urban redevelopment and investment in transport that has helped the city renew its DNA. The 2015 Global Power City Index powerfully illustrates the current strength of London's visitor and investor brands, and its status as a global centre for higher education and culture, as well as its reputation as a safe haven for capital and talent. London’s leadership is working towards long term plans to accommodate future population growth through increased infrastructure investment and co-ordination, densifying the centre of the city, and more intensive development of the older suburbs. London’s economy is diversifying with major growth in tech, med, and screen industries. GCPI 2015 also highlights the need for cities like London to address the housing supply and affordability challenges that accompany success. London has made great progress in education, safety, and transport, but the key challenge is now to address the housing imperative and also to tackle air quality and public health.
Greg Clark CBE
Chairman, The Business of Cities
Visiting Professor, University College London
The 2015 GPCI provides valuable insights into not only the competitive ranking of global cities, but also into the factors that impact the significant changes we saw in the rankings this year. For instance, certain North American cities show marked improvement due to investments in infrastructure and quality of life, with cities like Los Angeles surging ahead. By contrast, we are seeing the impacts of poorly planned urbanization and consequent downgrades in quality of life in Beijing and Shanghai. The message is quite clear: in order for global cities to compete for increasingly mobile human capital, they must improve the quality of life they offer residents and businesses in terms of great design, efficient infrastructure, a cleaner environment and diverse cultural exuberance.
Vishaan Chakrabarti
Founder and CEO, Partnership for Architecture and Urbanism (PAU)
Associate Professor of Practice, Columbia University
According to the GPCI 2015 results Paris leads the world ranking in terms of “livability”, a position supported by the unique value of its architectural and urban heritage. On the economic front however, the city has yet to address the challenge of reinforcing its attractiveness.
A first urban strategy which could help nurture new economics is already gaining momentum: the Greater Paris Metropolitan Area will be enforced on January 1st 2016. Still, I believe that the historical heart of Paris could just as well receive major architectural and urban renewal. In order to do so whilst preserving the heritage to which Paris owes much of its current ranking, I suggest to explore the vast and untapped reserves of land that our capital city possesses below its surface.
Dominique Perrault
Architect-Urban Planner
Praemium Imperiale 2015 Laureate
Tokyo benefits from a well-crafted, relatively new building stock which can be considered appropriate to living standards of our times. Apartment blocks are convenient, office towers are efficient, retail commerce is flourishing, the transport network is sophisticated, there is a good amount of parks and greenery, all is clean and well maintained. Life in Tokyo is smooth and generally enveloped in a feeling of safety.
But Tokyo MUST build on this solid base to add cultural spark to the city. More so than ever people today crave for an emotionally enriching time and are drawn by inspiring experiences that make for long lasting memories, this is the new luxury!
Tokyo needs awe inspiring iconic buildings, it could showcase it’s deeply rooted culture of food, art, design and music much more, in the shape of a design museum featuring Japan’s prolific industrial design for example. Or a fashion museum ranging from the kimono up to today’s much admired Japanese clothing, a Japanese film museum, a Japanese car museum. The keyword should be ‘Pleasure’, provide that and innovation and investment will automatically follow.
Astrid Klein
Architect and Co-founder, Klein Dytham architecture